
Seeing Double and Measuring Twice
Stereoscopy, Data Quality, and Multiple Perspectives

In 2015 I spent about half a year in Argentina. I spent a few weeks in Chile, looking for good skiing and getting a quick sense of how the long and tall Pacific country compared to the more stout Atlantic facing country. 10 years later, I continue to have a fascination with “the Southern Cone”, particularly Patagonia, Tierra del Fuego, the fjords of southern Chile (all from geography perspective) as well as authors like Borges and Bolaño, Argentine films (I have seen far fewer Chilean ones but am searching), the Gaucho mythology and history, and much more. The region dazzles me because it feels familiar yet faraway, strange, and as if it is a parallel universe to the America where I grew up and Europe where I live.
I mention these two countries because they somewhat mirror each other on either side of the great cordillera of mountains that runs through them, dividing them yet providing a common backstop. It is quite impossible to describe the entire Southern Cone as a single cultural entity nor continuous geographical unit, and instead the contrast between them becomes a sort of stereoscopy enabling a complete view through depiction of very different aspects. The language (Chilean vs. Argentine dialects), geography and climate, food, historical trajectory—all of it is quite different on one side of the mountains as opposed to the other, and each side is well explained by contrasting to the neighbor.
Stereoscopy is a term that became more relevant in much of my work recently, a term I only discovered after leaving Argentina in 2015. My first encounter with this was in terms of computer vision, and terrestrial, forward facing photos (like those of your mobile phone camera). A single image of a scene, like a Mapillary street view image looking at a public street, leaves quite a bit of mystery in spatial understanding. How far away is each building from the observer? How wide is the road?
Multiple images of the scene, even just from the next image in a sequence of street view images, perhaps 3 meters ahead, vastly increase the ability to infer things about what is in the scene. With stereoscopy, I often think of it not as a pair of images in a sequence, but the way two eyes work, one image being just slightly to the left or right of the other, observing the same thing. Our eyes and brains use this very well to understand 3D space, shapes, depth and distance.
This is an important technical concept, but my interest in the idea of stereoscopy is more about a broader spatio-philosophical idea where multiple observations of something enhance the value of data.
OpenStreetMap is a huge repository of map data, but many individual objects in it, from a barber shop location pin to a particular sidewalk or the polygon representing a warehouse, have been contributed only by a single, often anonymous user. Occasionally I use the app Every Door to add OpenStreetMap data to the map on the go, and I notice points of interest (POIs) that give a warning in the app: “Amenity is 9 years old.”
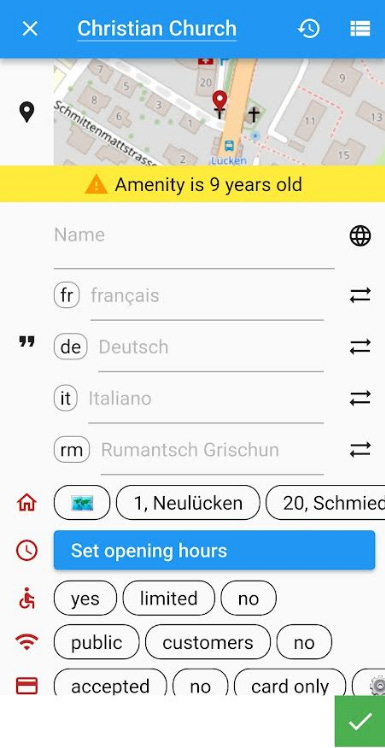
The implication is that its reliability is in question. I often take action to affirm that it exists, the best way being to add a few more attributes like whether the place accepts credit cards, or adding opening hours, or sometimes even slightly correcting the pin location. Suddenly the place has been confirmed to exist by two people, perhaps 7-8 years apart. This makes it quite reliable, though as time passes my second attestation decays in value. However, we have two pairs of eyes making an observation, not just the same person twice—two unique people who reinforce one another. Data only provided by the same party again and again could still be considered lacking independent verification.
From aerial and satellite imagery, you may also have some situations that involve multiple views. There is stereoscopic vision available, helping to use multiple images with about the same timestamp to understand a scene the same way the street view image is understood. Then there is time-series data, where multiple pass—say a few days, a few weeks, or a year apart—can confirm patterns, like whether something is still there (an active volcano or a flooded area), actively changing (progression of a forest fire or influx of ships to a port), or a growth of understanding in what it is, for example observing an ecosystem across multiple seasons and weather events to classify it in a certain way.
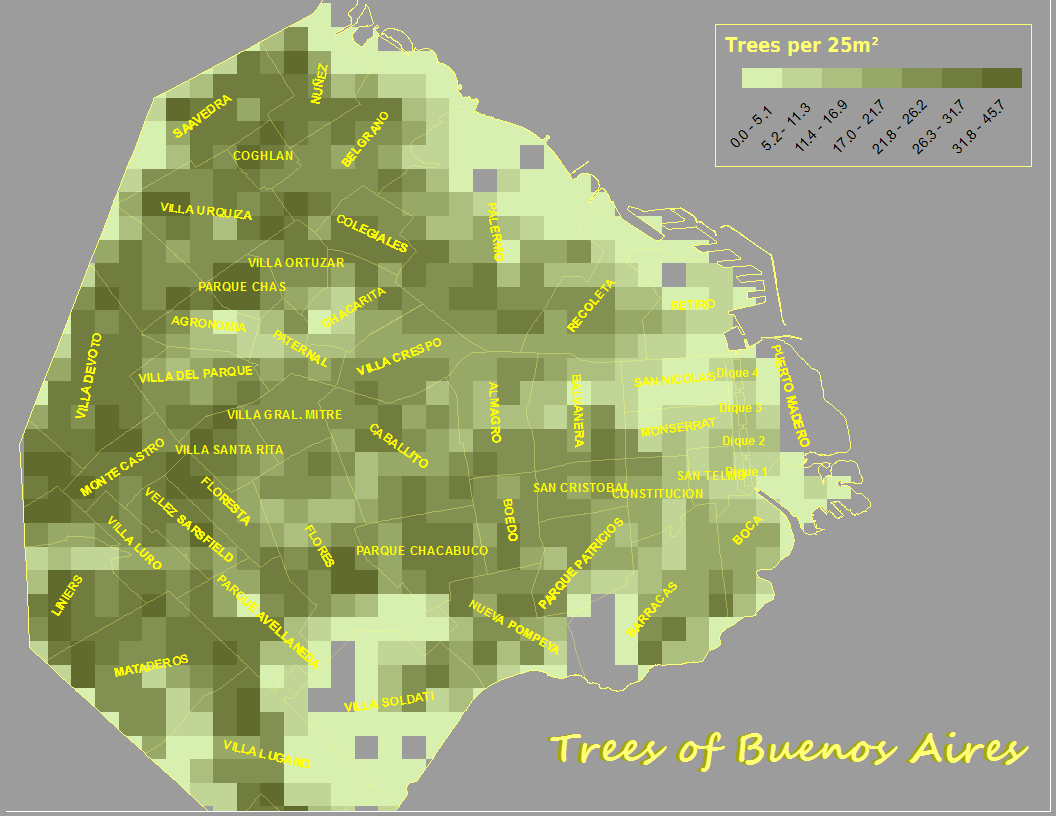
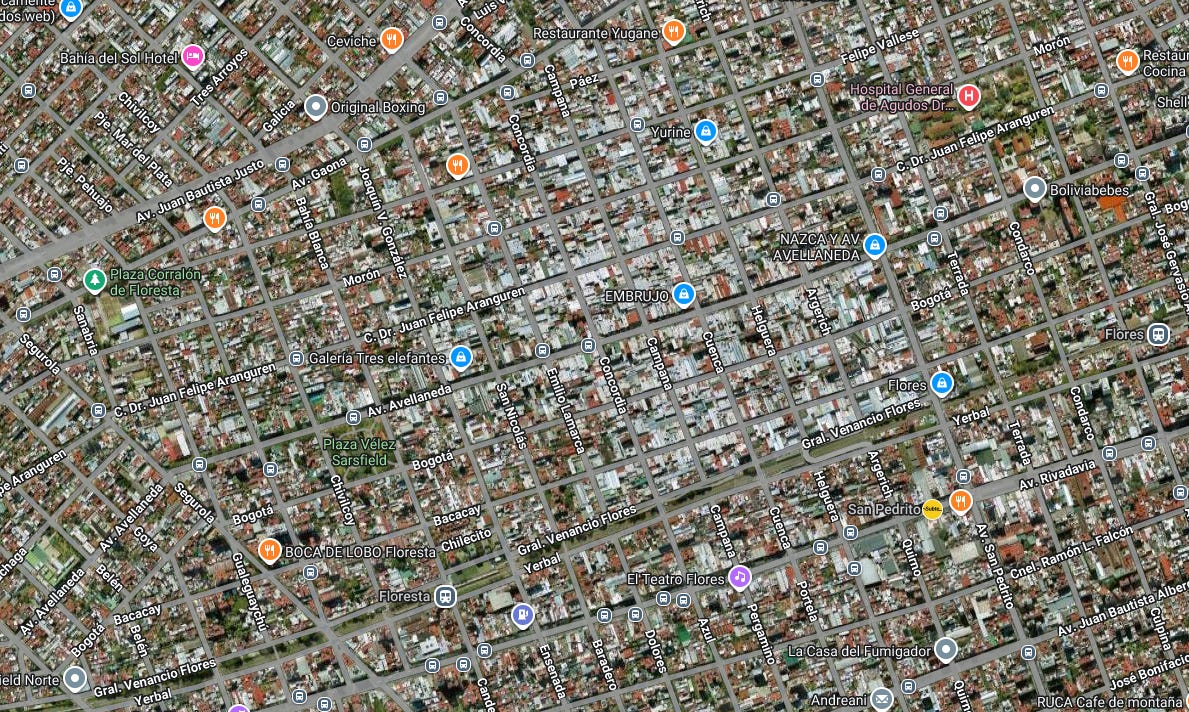
In my Buenos Aires days, I was also doing some independent study of the urban heat island (UHI) effect in the city, and trying to overlay it to green space and vegetation in the city. This comparative study of two datasets also builds understanding, like having not just two eyes in stereoscopy, but also two different types of eyes (like optical and infrared). In my own study, the data showed an unusually cool spot in the neighborhood called Floresta.
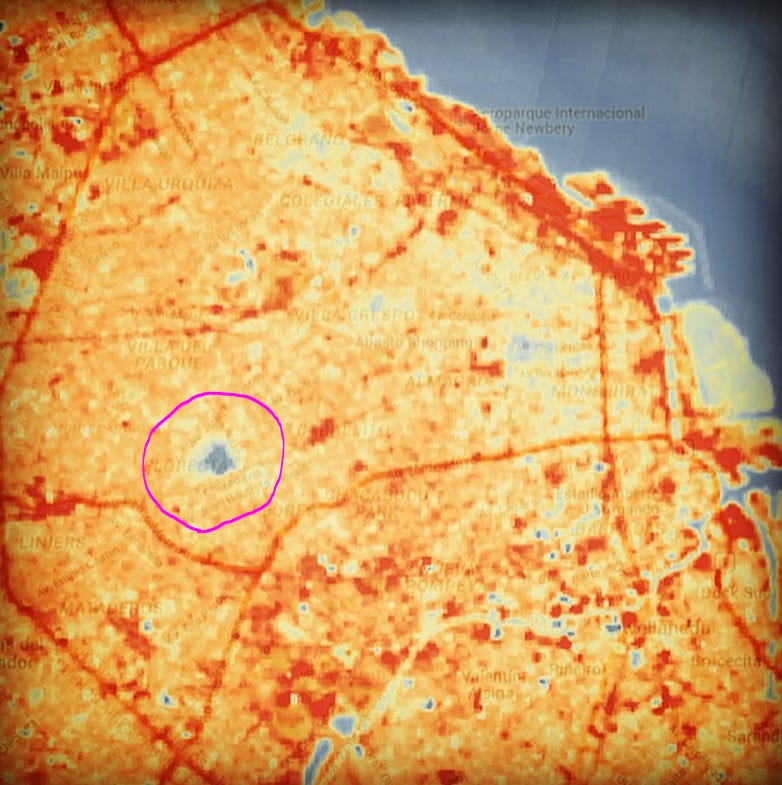
I looked on the map, looked at street view, and then made a trip down their myself. I really could not find any explanation for it. No water body, not any particular concentration of green space, no special reflective roofs (maybe slightly whiter in color). It probably was an artifact of that specific image, and being a small experiment I let it go and did not dive deeper—but using multiple images across time, or from multiple providers, would have helped confirm an anomaly. I was hoping on the other hand, to see a pattern: a clue to how urban design can accidentally cause cooler temperatures.
Blockchain uses a system of validation to ensure that proper data enters the ledger of record. Someone can mine Bitcoin, then someone can be selected to validate what is mined, then if validated it becomes officially “live”. I have seen similar attempts in map data, from HOTOSM doing validation of the crowdsourced edits, to Google Maps double checking with users if a place exists.
One of the interesting aspects in Bitcoin and blockchain is that the person validating may need to take economic risk. They essentially set aside some of the existing Bitcoin of their own as collateral, then validate some other object, and get back what they staked as collateral if all goes well. Any dishonesty or negligence could risk what they staked.
In mapping and data, there is also a sense of risk involved in validation. Reputational risk is the main one, and the stakes, let’s say, are sometimes not as high as losing money. An OSM contributor who contributes bad data will have it checked by a validator. A validator who does poor work has a bigger reputational risk—they are expected to catch errors. Few if any would intentionally validate poorly, although neglect is more likely that malice.

In imagery, neglect or human error is more likely than malice too. The risk of a satellite continuing to showcase an error in the sensor data is also reputational, but can translate to financial risk—need for corrections at cost. Users expect reliable data as truth, so for example constantly misreading the spectral signature would quickly stop many people from using or even funding/paying for the services of a satellite provider.
Open source code can also be quite similar. In some of my own work, I do a lot with street view cameras and finding the pose and angle that the camera has. Predicting the map location of an object in the camera view requires some quite complicated equations—processing image coordinates, estimating offset camera angles, finding relative depth where possible, and considering possible errors in the GPS and camera angle. Sometimes revisiting my own Python code months later I forget how I even came up with some methods, and even find I could do it better.
In open source code, complexity like this is exposed to a wide community. In my own team of professionals, it may be unlikely a colleague looks into my code and corrects it, because they do not specialize in this and also have their own work to do. Most of the people who have the same specialization as me are working somewhere else, so open source can mean validation of methods that people otherwise might take for truth and rely on, at small or great risk of errors that echo through other systems.
This is a big strength of tried and tested open source systems, and a reason why I think utilities such as Python libraries are very ideal as open source, as opposed to thinks more about user experience like a mobile app (though there are good reasons all around for open source). GDAL, Shapely, Rasterio, Mercantile, and many more libraries thrive from open source contributions, even if it’s just validation and not new code.
Overall, there is a bigger question of how authoritative data can be, or how reliable, just based on expertise alone. Professionals may collect a dataset or transform and overlay several to make something new, but this is limited by how many observations, form how many observers and how many viewpoints, were used. Timestamps also are a limitation, as well as how well data can even be aggregated and averaged across time, or whether it is expected to be static or dynamic.
In general, I wonder if there are more clever ways to introduce a concept of stereoscopy, perhaps not literally but in an abstract sense of dual validation, into geospatial data. High confidence scores can correlate to high value, and low confidence scores—or unknown confidence—can sink a dataset or limit its application.
In the long term, I think all maps for machine use will be elegant composites of many views of the world, and this is bound to bring out contradictions. With many contradictions comes an increased need to validate, confirm, adapt or adjust measurements. Most likely, I think there is a market demand for validation and confidence scoring of data that comes from a single source, with single point in time and single “sensor” (could be a human like “Citizens as Sensors” says) and thus has high risk of error. What kind of approach can make a valuable service out of that?
Christopher, is this really a thing?
"Most likely, I think there is a market demand for validation and confidence scoring of data that comes from a single source, with single point in time and single “sensor”"
This seems like madness. I echo your question, what good could come of this?